
A Precise Statistical Analysis Categorically Proves
POTUS Imposter Joe Biden Stole the 2020 Election
SOTN Editor’s Note: There are many types of evidence that can serve as categorical proof of a crime or crime spree. There are at least 17 types of evidence which can be used in a legal context to both indict and convict a criminal or crime syndicate as the Democrat Party has become. As follows:
Direct evidence
Circumstantial evidence
Physical evidence
Individual physical evidence
Class physical evidence
Forensic evidence
Trace evidence
Testimonial evidence
Expert witness evidence
Digital evidence
Documentary evidence
Demonstrative evidence
Character evidence
Habit evidence
Hearsay evidence
Corroborating evidence
Statistical Evidence
Different categories of crimes are more easily proved with the various types evidence. For example, election theft is extremely easy to prove with statistical evidence. As long as the underlying statistics are accurate, the numbers don’t lie.
Which brings us to the 2020 POTUS election.
The following rigorous statistical analysis proves beyond a shadow of a doubt that POTUS Imposter Joe Biden and the Democrat Party perpetrated a highly organized criminal conspiracy to steal the 2020 POTUS election.
That the official and documented election outcomes from 1988 through 2016 in 22 “Bellwether Counties”, all went contrary to the well established historical pattern of voting, serves as ironclad and irrefutable evidence that the 2020 election was stealthily and successfully stolen.
State of the Nation
January 6, 2023
The Fall of the Bellwether Counties
Posted by ElectionFraud20.org
📃This article is part of a series on Identifying Electoral Fraud Using Trend Analysis.
There are 22 counties in the US that managed to vote for the winning party in every single election from 1988 to 2016. Their finger was so tightly on the pulse of America that they not only picked the winner each time, but managed to accurately flip parties four times in that period. These are the “bellwether” counties.
But what if we told you that only 1 of these 22 counties voted for Biden in 2020?
How did the others all get it so wrong?
Let’s take a closer look.
Bellwether counties are important, and their significance should not be downplayed. They have a rare and unique property of having a perfect demographic mix that allows them to vote for either party based on the merits of each election, and always get it right.
(Think about what it takes, and what is required for a county to always get the election right. Don’t simply gloss over this. Take the time to ponder and realize that this is no mean feat! It requires a lot more than “pure luck”.)
It far surpasses any “statistical” explanation, because at the end of the day we are dealing with real people, with real personalities, concerns and aspirations, which happen to align perfectly with the whole American population.
Their concerns are real. Their hopes are real. The matters that way on their minds are real. Their emotions and decision making process are real. They are not a “statistical” curiosity, but the perfect distillation or embodiment of the whole country’s sentiment.
Please keep this in mind as you continue to read through our bellwether analysis. (Needless to say that if the tables were reversed, we would hear no end of the significance of bellwether counties in the media.)
What does it take for a county to be a bellwether?
Let’s turn the clock back to 1988.
For a county to be considered a bellwether it would have to vote for the winning party at each of the following elections:
| 1988 | Republican | |
| 1992 | Democrat | 🔄 switch |
| 1996 | Democrat | |
| 2000 | Republican | 🔄 switch |
| 2004 | Republican | |
| 2008 | Democrat | 🔄 switch |
| 2012 | Democrat | |
| 2016 | Republican | 🔄 switch |
That is 4 switches in 8 election cycles! Out of 3,141 counties, there were 22 counties that had successfully voted for the winning candidate in each and every election between 1988 and 2016 (included).
If bellwethers were just a “statistical curiosity” and purely random, we could expect half of these counties to pick the winning party at the 2020 election.
But there was only one county – Clallam, Washington – which voted Democrat. All other 21 counties voted Republican.
It is easy to gloss over this. We already claimed that bellwether counties are a lot more than “statistical curiosities”, but let’s assume for the time being that normal rules of probability apply…
If you take a coin and flip it 22 times. What are the odds of getting 21 “heads” or 21 “tails”?
The probability is hard to comprehend, so let’s figure it out for real. Let’s find a coin, and flip it.
Really … stop reading. Find a coin, and flip it, and see how long it takes to (just) get 10 heads or 10 tails in a row.
Or even better, if you have children, get them to do it for you. It will keep them entertained for hours, and you can tell them it is for a good cause. 😉 After you have spent an hour trying, record the maximum streak length you achieved.
You should now have a real tangible sense of how difficult it is to get a streak of 10. Now imagine getting 21 out of 22…!
Furthermore, consider the fact that bellwethers don’t just have a random 50% chance at winning — we should expect them to have a better than 50% chance of getting it right.
For the mathematically-minded: the table below shows that county outcomes do loosely follow a random outcome, up until a point. After 8 elections, the number of counties left standing defy the odds, and it is this fact that makes them “bellwether” counties.
The table shows the number of counties that voted for the winning candidate since the 1988 election. Keep in mind that if we started the attrition from the 1980 election, there would still be 19 counties standing after the 2016 election. That is 19 counties still standing after 10 elections! (From a purely random statistics perspective, there should only be 1 or 2 standing. The fact that there were 19 demonstrates the incredible predictive abilities of these counties.)

Somehow we jumped from 22 to 1 county in one election cycle and we are supposed to believe that is “normal”?
The odds of 21 counties out of 22 missing the mark is extremely remote!
Summary:
Here are the concepts we have established so far:
- Bellwether counties are not just “statistical curiosities”
- The odds of 21 (out of 22) of these counties getting it wrong is extremely unlikely
This is just the beginning. It gets a lot more interesting…
Are some bellwethers better than others?
Let’s introduce a new concept: the “quality” of prediction. Bellwether counties are already extremely rare, but some bellwether counties are better than others at highlighting a change in sentiment.
How so?
Well, let’s consider the percentage gap between the winning and losing party in these counties. In other words, how strongly do they swing to the winning party?
The best bellwether counties will consistently vote more than 50% for the winning party. (Independent parties will reduce the winning margin between the two major parties.) Here are the counties that consistently voted more than 50% for the winning party since the 2000 election:

There are only 4 counties.
To make things a little more interesting we will relax the constraints a little to include “modern” bellwether counties, that is, counties that have voted for the winning candidate since 1992. This favors the Democrat party since we are excluding counties that voted Republican in 1988. In other words, we are including more counties that are more likely to vote for the Democrat party.
Re-doing the analysis we obtain 35 modern bellwether counties after the 2016 election. Of these 35 counties, 10 of them consistently voted over 50% for the winning candidate since the year 2000. They are:

Notice RANSOM, SARGENT, and MARSHALL in particular. Outstanding. Their ability and sensitivity to dramatically switch parties in 2000, 2008 and 2016, is outstanding. It clearly shows they hold no allegiances and will vote for whichever party makes the most sense to them at each election. They simply vote on merit.
Since only Clallam County voted Democrat in 2020, we know they all voted for the Republican party in 2020 and got it wrong. The question is, how much did they get it wrong by?
We know these counties are the “best of the best” at predicting the election winner. So, even though they got it wrong in 2020, it is still worth figuring out how much they got it wrong by.
Did they narrowly miss out on voting for the Democrat party in 2020?
How many of these counties voted less for the Republican party in 2020? (It will at least show a trend away from the Republican party that would help make more sense of this situation.)
You can find the answers to the above questions yourself by searching this site: politico.com/2020-election/results
(Go to the bottom of the page. Click on the relevant state then look for the county name.)
Once you have found all the results and looked at the trends, remember, these counties are the best counties at predicting an election outcome!
If the Republican percentage in 2020 is less than in 2016, it would clearly indicate a change in sentiment away from the Republican party, towards the Democrat party. The magnitude of the gap (or difference) is an indicator of the strength of the change in sentiment.
Which counties are the best at “swinging”?
In this section we will introduce a new concept: The “swing” county.
A “swing” county is a county that voted correctly for the winning party at one election and then voted for the other winning party at the next election.
To make things more interesting we will only look at “swing” counties since the 2004 election. (i.e. We will only focus on the most recent elections to increase the pool of counties to analyze.)
So, for our purposes, a “swing” county would have voted as follows:
| 2004 | Republican | |
| 2008 | Democrat | 🔄 switch of party |
| 2012 | Democrat | |
| 2016 | Republican | 🔄 switch of party |
There are 80 such counties. Let’s rank these counties from “highest to lowest” Democrat voting percentages in the 2008 election. (See the “DPV 08” column in the image below.) These counties turned out to vote strongly for the Democrat party in 2008, so they are the most likely to swing back to the Democrat party in 2020.
Here are the top 50 counties by Democrat voting percentage in 2008:

How many of these counties swung back to the Democrat party in 2020?
You can find the answer by searching politico.com/2020-election/results
We’re not going to just give you the answer, since the significance of the result might be lost on you. Go on, look them up! Bonus points if you also keep track of the trends from 2016 to 2020.
Summary:
Here is a quick recap of what we have established so far:
- Bellwether counties are not just “statistical curiosities”
- The odds of 21 (out of 22) of these counties getting it wrong is extremely unlikely
- We have identified and analyzed the “best of the best” bellwether counties at predicting an election outcome, and examined their trends in 2020. (You can make up your own mind on what the trends mean.)
- We looked at the most recent “swing” counties and determined how many of the strongest Democrat voting counties in 2008, swung back to the Democrat party in 2020.
What about counties that are great at “switching”?
We will now introduce another new concept, called a “switch” county. A “switch” county is our name for a county that happens to vote for the winning party whenever there is a change of parties, ignoring how they voted for the incumbent.
💡TIP: You have probably noticed by now that with each new section we write, we are “relaxing” the constraints to make it easier to build a case for the Democrats winning the 2020 election.
Concretely, a “switch” county would have voted for the following parties:
| 1992 | Democrat | 🔄 switch of party |
| 2000 | Republican | 🔄 switch of party |
| 2008 | Democrat | 🔄 switch of party |
| 2016 | Republican | 🔄 switch of party |
(We ignore how they voted in 1996, 2004 and 2012 when the parties stayed the same.)
There are 150 such counties.
It is important to realise these counties have no allegiances whatsoever and will happily vote for whichever party makes the most sense to them based on merit.
Here are the top 30 sorted by the “highest to lowest” Democrat percentage vote in 2008, that’s the “DPV 08” column:

Here’s what you need to look into:
- How many of these 150 “switch” counties voted Democrat in 2020?
- Or, if you don’t have enough time, how many of the top 10 “switch” counties, which overwhelmingly voted Democrat in 2008 (with a percentage Democrat vote over 58% !), voted Democrat again in 2020?
Find out at politico.com/2020-election/results.
Summary:
Let’s quickly recap what we have established so far:
- Bellwether counties are not just “statistical curiosities”
- The odds of 21 (out of 22) of these counties getting it wrong is extremely unlikely
- We identified and analyzed the “best of the best” bellwether counties at predicting an election outcome, and examined their trends in 2020. (You can make up your own mind on what the trends mean.)
- We relaxed the constraint by introducing the concept of a “swing” county, i.e. a county which has voted Republican in 2004, but swung to the Democrat party in 2008 and then back to the Republican party in 2016.
- We further relaxed the constraint by introducing the “switch” county. i.e. A county that voted for the winning party in 1992 (Democrat), 2000 (Republican), 2008 (Democrat) and 2016 (Republican), irrespective of how they voted at the other elections. The idea being these counties are good at sensing a change of sentiment and will happily vote for whichever party makes the most sense to them.
Recent “switch” counties
In this post we will further relax the constraint by analyzing counties that voted Democrat in 2008 and Republican in 2016 only; that is, the “switch” counties in the most recent elections.
There are 391 such counties. We sorted the counties from “highest to lowest” Democrat percentage vote (in the 2008 election). There are 25 counties with a Democrat percentage vote over 60%. The highest percentage being 66.1%.
Here are the top 25 counties which voted over 60% for the Democrat party in 2008, and then voted Republican in 2016:

There is no doubt these 25 counties heavily favor the Democrat party. So the question is, how many of them “switched” back to the Democrat party in 2020?
Again, you’ll appreciate the results when you dig some of them up yourself. Find the answer by searching politico.com/2020-election/results.
Summary
Swing Counties:
There are 80 “swing” counties.
When sorted from the “highest to lowest” Democrat percentage vote (at the 2008 election), we can see that there is 1 county that has a percentage Democrat vote greater than 60% at the 2008 election. (The highest value being 60.6%)
Switch counties:
There are 150 “switch” counties.
When sorted from the “highest to lowest” Democrat percentage vote (at the 2008 election), we can see that there are 4 counties that have a percentage Democrat vote greater than 60% at the 2008 election. (The highest value being 66.1%)
Recent Switch counties:
There are 391 recent “switch” counties.
When sorted from the “highest to lowest” Democrat percentage vote (at the 2008 election), we can see that there are 25 counties that have a percentage Democrat vote greater than 60% at the 2008 election. (The highest value being again 66.1%)
With such overwhelming Democrat support in 2008, one can only surmise that ALL these 25 counties would have switched back to the Democrat party in 2020. Especially since Biden received million more votes than Obama did in 2008.
Conclusion
We have looked at every imaginable scenario to build a case for the Democrat party winning the 2020 election based upon how our “trusted” counties voted. With each new section we relaxed the constraint, to include the most friendly Democrat voting counties in the country (based on the 2008 election). We highlighted the counties that voted the highest for the Democrat party in 2008 as it is a clear indicator of their propensity to vote for the Democrat party.
Have you looked at the results of these counties? If you’ve done your research and found the 2020 results for each of these counties, you should find the results extremely puzzling.
So did we.
___
https://electionfraud20.org/in-detail/bellwether-states-counties-2020/
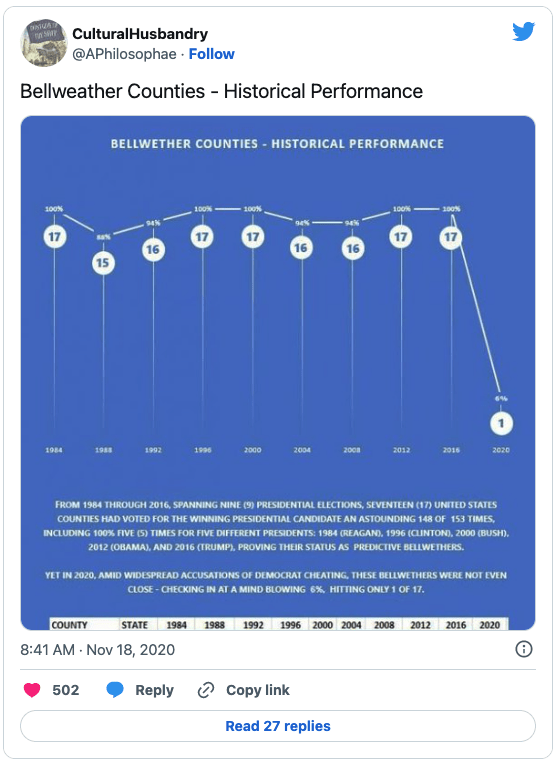
SOTN Editor’s Note: Now here’s another take on the very same type and cogency of statistical evidence. Only this time the statistical analysis concerns 17 bellwether counties throughout the USA. See the graph below which clearly indicates that something went very wrong during the 2020 POTUS election.
_____
Bellweather Counties – Historical Performance pic.twitter.com/bzcJcfCu3t
— CulturalHusbandry (@APhilosophae) November 18, 2020