
What’s the nation’s progress on vaccinations?
Posted by USA Facts
At least 270,227,181 people or 81% of the population have received at least one dose.
Overall, 230,637,348 people or 70% of the population are considered fully vaccinated.
Percent of people receiving vaccines in the US
![]()
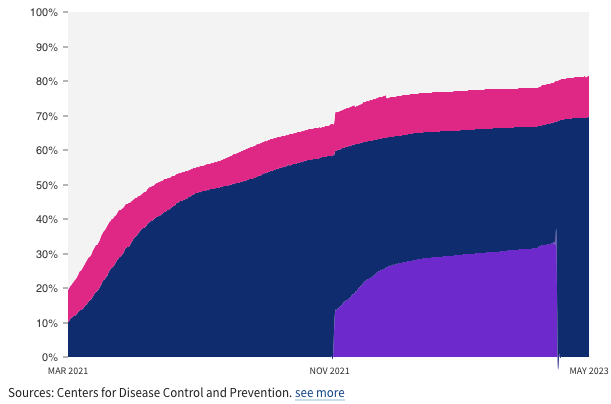
Sources: Centers for Disease Control and Prevention. see more
In the US, 984,444,295 doses have been distributed so far, with 68% or 676,728,782 of the doses used.

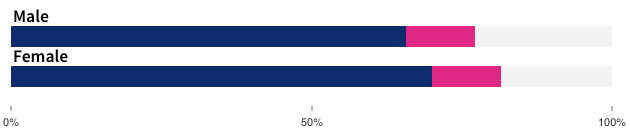
How do COVID-19 vaccinations differ by sex?
Percent of people by sex receiving at least one dose or fully vaccinated.
According to the Centers for Disease Control and Prevention, there is sex information for 99% of people who received at least one dose and 99% of fully vaccinated people.
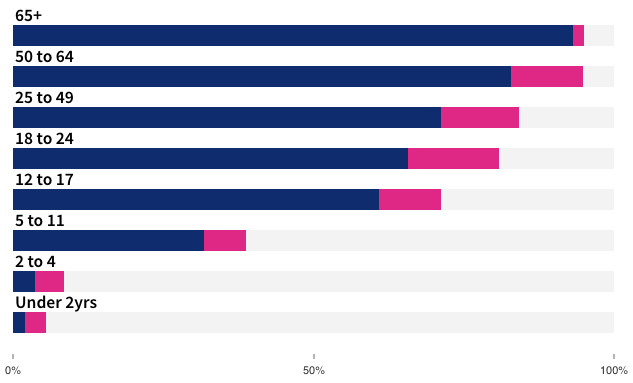
What percentage of people in each age range received the COVID-19 vaccine?
Percent of people by age receiving at least one dose or fully vaccinated.
According to the Centers for Disease Control and Prevention, there is age information for 99% of people who received at least one dose and 99% of fully vaccinated people.
What percentage of people in each race or ethnic group received the COVID-19 vaccine?
According to the Centers for Disease Control and Prevention, there is race or ethnic information for 75% of people who received at least one dose and 78% of fully vaccinated people.
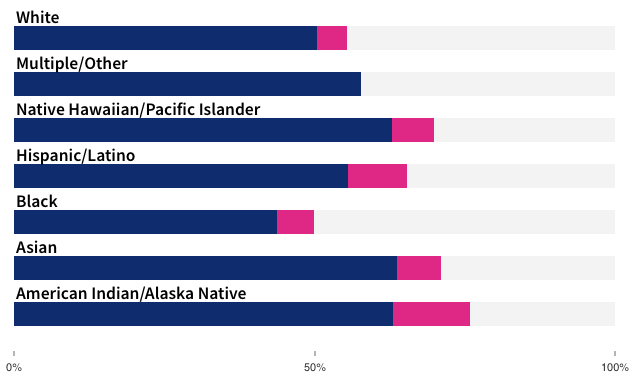
Excluding the Hispanic/Latino category, all groups include the non-Hispanic population only.
More COVID-19 Data:
Compare states’ vaccination progress or select a state to see detailed information
Percent of state’s population who have received vaccines according to most recent state data.
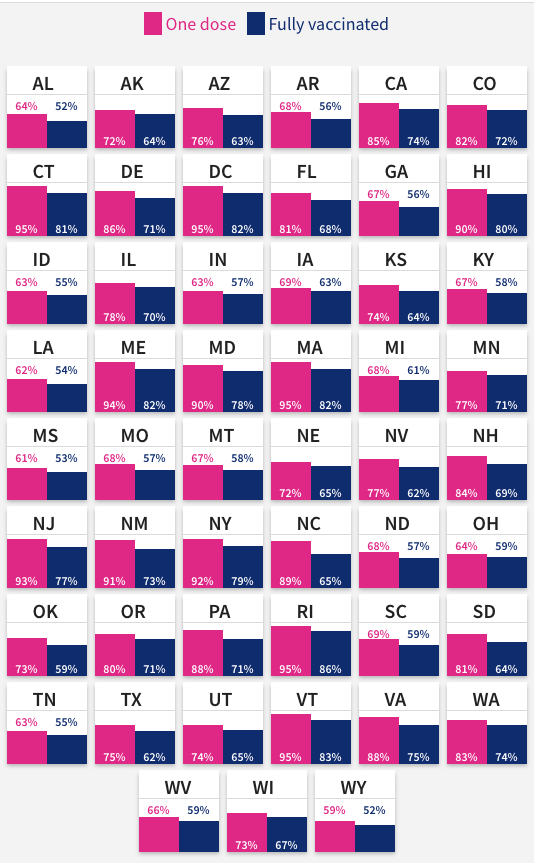
Last updated 10-19
| State | % of population with at least one dose | % fully vaccinated | % with booster or additional dose |
|---|---|---|---|
| AL | 64.3% | 52.5% | 20.1% |
| AK | 72% | 64.4% | 30.8% |
| AZ | 76.4% | 63.8% | 29.4% |
| AR | 68.8% | 56.1% | 24% |
| CA | 85.2% | 74.2% | 41.5% |
| CO | 82.2% | 72.4% | 40.5% |
| CT | >95%* | 81.8% | 44.3% |
| DE | 86.3% | 71.8% | 35.4% |
| DC | >95%* | 82.1% | 37.9% |
| FL | 81.4% | 68.6% | 29.4% |
| GA | 67.3% | 56.4% | 23.6% |
| HI | 90.2% | 80.5% | 46.8% |
| ID | 63% | 55.7% | 26% |
| IL | 78.1% | 70.3% | 39% |
| IN | 63.6% | 57.2% | 28.2% |
| IA | 69.7% | 63.5% | 35.4% |
| KS | 74.9% | 64.1% | 30.3% |
| KY | 67.9% | 58.9% | 27.7% |
| LA | 62.3% | 54.6% | 23% |
| ME | 94.6% | 82.1% | 48.6% |
| MD | 90% | 78.3% | 43.1% |
| MA | >95%* | 82.2% | 44.8% |
| MI | 68.6% | 61.6% | 35.2% |
| MN | 77.5% | 71% | 43.4% |
| MS | 61.1% | 53.3% | 21.4% |
| MO | 68.2% | 58% | 26.5% |
| MT | 67.2% | 58.4% | 29.5% |
| NE | 72.3% | 65.3% | 35.2% |
| NV | 77.6% | 62.6% | 26% |
| NH | 84.8% | 69.7% | 35% |
| NJ | 93.2% | 77.9% | 39.4% |
| NM | 91.7% | 73.7% | 39.1% |
| NY | 92.9% | 79.4% | 38% |
| NC | 89.2% | 65% | 19.5% |
| ND | 68% | 57.4% | 26.7% |
| OH | 64.9% | 59.7% | 33% |
| OK | 73.4% | 59.4% | 23.9% |
| OR | 80.2% | 71.3% | 40.6% |
| PA | 88.5% | 71.5% | 32.6% |
| RI | >95%* | 86.1% | 48.8% |
| SC | 69.9% | 59% | 25.5% |
| SD | 81% | 64.6% | 29% |
| TN | 63.8% | 55.8% | 26.2% |
| TX | 75% | 62.4% | 23.5% |
| UT | 74.3% | 65.9% | 31.7% |
| VT | >95%* | 83.9% | 54% |
| VA | 88.9% | 75.4% | 39% |
| WA | 83.7% | 74.8% | 42.1% |
| WV | 66.7% | 59.1% | 28.6% |
| WI | 73.9% | 67.3% | 39.8% |
| WY | 59.8% | 52.3% | 24% |
___
https://usafacts.org/visualizations/covid-vaccine-tracker-states/