GENOCIDE IS GENOCIDE IS GENOCIDE
SOTN Editor’s Note: There seems to be a gross misunderstanding of the definition of “genocide” as seen in comment sections across the Alt Media.
First of all, much of the hard scientific data has conclusively proven that the COVID-19 ‘vaccines’ were specifically formulated as killshots, clotshots, cancershots, etc. And, that the U.S. citizenry was just one of the targets of this extermination program. The other predictably targeted nations are identified in the following exposé:
RED ALERT:
OPERATION COVID-19 Has Three
Exceedingly Evil Goals
The critical point here is that to be correctly defined as a genocide does not mean that millions of people need to drop dead in a day and a night.
In other words, a slow-motion genocide, by way of an extremely dangerous and deadly ‘vaccine’ bioweapon, is every bit as much of a genocide as the brutal mass murder of tens of thousands of innocent Palestinian civilians in Gaza by the Israeli war machine.
Not only that, but this long planned and highly organized Covid vax depopulation scheme has several killing components, some of which are discussed in the link below:
THE COVID-19 EXTINCTION LEVEL EVENT
It’s also crucial for the Patriot Movement to comprehend the real target of this meticulously calculated genocide throughout the USA. For only when folks in flyover country grasp the true enormity and gravity of this silent slaughter will they feel empowered to rise up against the responsible genocidal maniacs.
It’s not just WHITE REPLACEMENT … it’s also a highly
organized GENOCIDE of Christian Patriots across the USA.
As for the cold and calculating efficiency of this genocidal operation across America, the following article provides the raw data which demonstrates just how successful this extermination and debilitation enterprise really was.
Remember, the NWO goal all along was to jab as many Americans as possible not only to murder them, but also to debilitate tens of millions (which they have done) so that each severely sickened individual would require so much care that they would eventually take many Patriots out of action. Sly and stealthy or what?!
State of the Nation
May 29, 2024
N.B. The U.S. injection stats presented below are an exceedingly sad testament to the profound ignorance and cluelessness of the American people. It can only be that the citizenry has some VERY rough karma ahead because this slo-mo Extinction Level Event will only get worse…especially if they roll out a Bird Flu Plandemic on US. See: US ‘Looking Closely’ At Vaccinating Workers Exposed To Bird Flu: Official
THE GREATEST MANMADE TRAGEDY IN U.S. HISTORY
What’s the nation’s progress on vaccinations?
Posted by USA Facts
At least 270,227,181 people or 81% of the population have received at least one dose.
Overall, 230,637,348 people or 70% of the population are considered fully vaccinated.
Percent of people receiving vaccines in the US
![]()
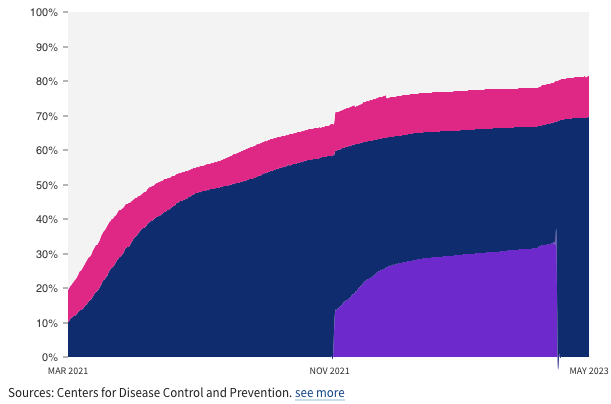
Sources: Centers for Disease Control and Prevention. see more
In the US, 984,444,295 doses have been distributed so far, with 68% or 676,728,782 of the doses used.

How do COVID-19 vaccinations differ by sex?
Percent of people by sex receiving at least one dose or fully vaccinated.
According to the Centers for Disease Control and Prevention, there is sex information for 99% of people who received at least one dose and 99% of fully vaccinated people.

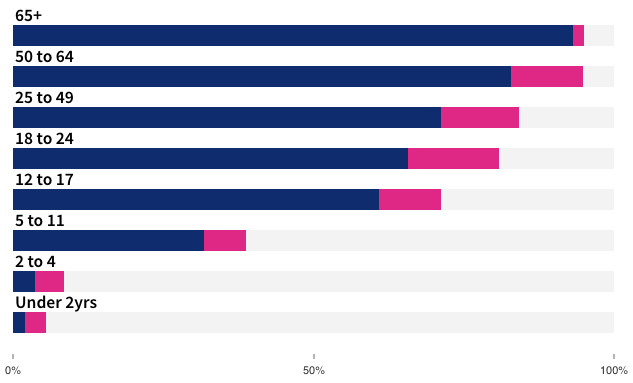
What percentage of people in each age range received the COVID-19 vaccine?
Percent of people by age receiving at least one dose or fully vaccinated.
According to the Centers for Disease Control and Prevention, there is age information for 99% of people who received at least one dose and 99% of fully vaccinated people.
What percentage of people in each race or ethnic group received the COVID-19 vaccine?
According to the Centers for Disease Control and Prevention, there is race or ethnic information for 75% of people who received at least one dose and 78% of fully vaccinated people.
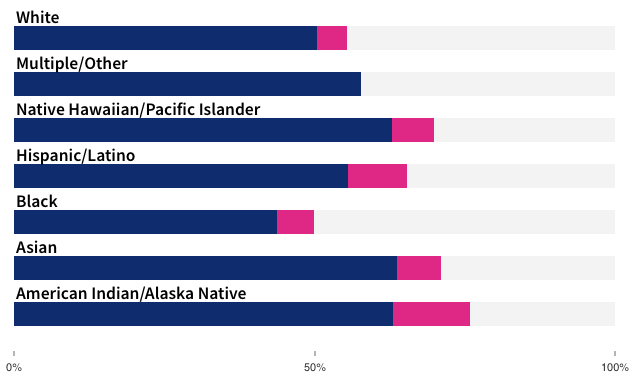
Excluding the Hispanic/Latino category, all groups include the non-Hispanic population only.
More COVID-19 Data:
Compare states’ vaccination progress or select a state to see detailed information
Percent of state’s population who have received vaccines according to most recent state data.
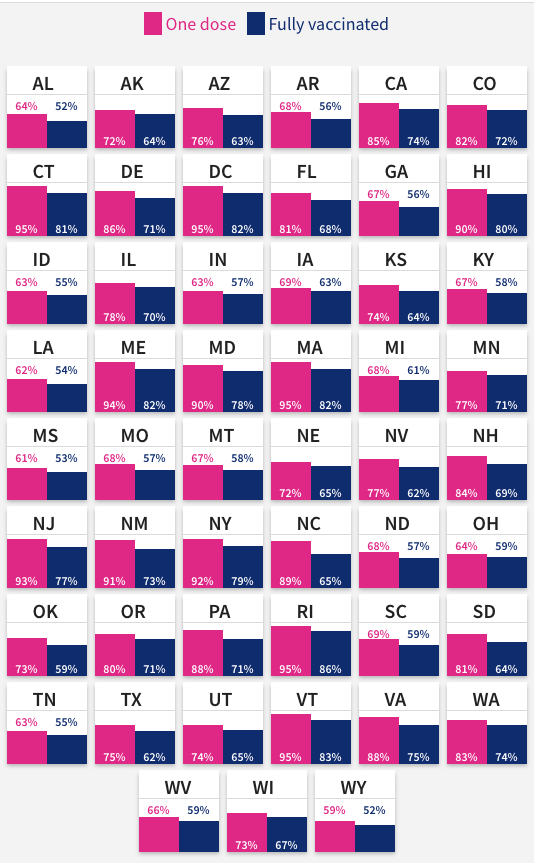
Last updated 10-19
| State | % of population with at least one dose | % fully vaccinated | % with booster or additional dose |
|---|---|---|---|
| AL | 64.3% | 52.5% | 20.1% |
| AK | 72% | 64.4% | 30.8% |
| AZ | 76.4% | 63.8% | 29.4% |
| AR | 68.8% | 56.1% | 24% |
| CA | 85.2% | 74.2% | 41.5% |
| CO | 82.2% | 72.4% | 40.5% |
| CT | >95%* | 81.8% | 44.3% |
| DE | 86.3% | 71.8% | 35.4% |
| DC | >95%* | 82.1% | 37.9% |
| FL | 81.4% | 68.6% | 29.4% |
| GA | 67.3% | 56.4% | 23.6% |
| HI | 90.2% | 80.5% | 46.8% |
| ID | 63% | 55.7% | 26% |
| IL | 78.1% | 70.3% | 39% |
| IN | 63.6% | 57.2% | 28.2% |
| IA | 69.7% | 63.5% | 35.4% |
| KS | 74.9% | 64.1% | 30.3% |
| KY | 67.9% | 58.9% | 27.7% |
| LA | 62.3% | 54.6% | 23% |
| ME | 94.6% | 82.1% | 48.6% |
| MD | 90% | 78.3% | 43.1% |
| MA | >95%* | 82.2% | 44.8% |
| MI | 68.6% | 61.6% | 35.2% |
| MN | 77.5% | 71% | 43.4% |
| MS | 61.1% | 53.3% | 21.4% |
| MO | 68.2% | 58% | 26.5% |
| MT | 67.2% | 58.4% | 29.5% |
| NE | 72.3% | 65.3% | 35.2% |
| NV | 77.6% | 62.6% | 26% |
| NH | 84.8% | 69.7% | 35% |
| NJ | 93.2% | 77.9% | 39.4% |
| NM | 91.7% | 73.7% | 39.1% |
| NY | 92.9% | 79.4% | 38% |
| NC | 89.2% | 65% | 19.5% |
| ND | 68% | 57.4% | 26.7% |
| OH | 64.9% | 59.7% | 33% |
| OK | 73.4% | 59.4% | 23.9% |
| OR | 80.2% | 71.3% | 40.6% |
| PA | 88.5% | 71.5% | 32.6% |
| RI | >95%* | 86.1% | 48.8% |
| SC | 69.9% | 59% | 25.5% |
| SD | 81% | 64.6% | 29% |
| TN | 63.8% | 55.8% | 26.2% |
| TX | 75% | 62.4% | 23.5% |
| UT | 74.3% | 65.9% | 31.7% |
| VT | >95%* | 83.9% | 54% |
| VA | 88.9% | 75.4% | 39% |
| WA | 83.7% | 74.8% | 42.1% |
| WV | 66.7% | 59.1% | 28.6% |
| WI | 73.9% | 67.3% | 39.8% |
| WY | 59.8% | 52.3% | 24% |
___
https://usafacts.org/visualizations/covid-vaccine-tracker-states/
