
Submitted by Harold Saive
SOTN Special Report
This adds yet more evidence that we are witnessing the greatest safety signal in the 31-year history of VAERS.
A few weeks ago we announced that you can now search COVID VAERS reports by STATE. We have heard from many people across the country who have used the “by STATE” feature to educate elected officials about vaccine injuries happening in their jurisdiction.
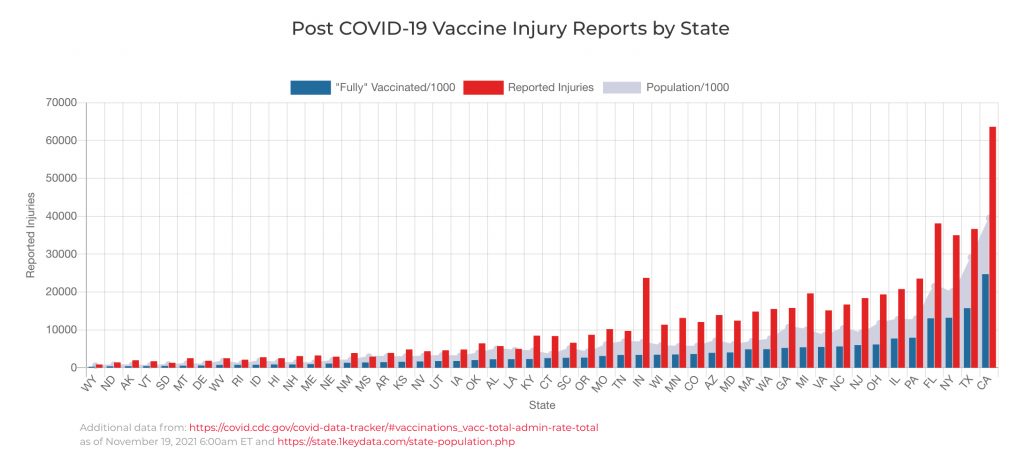
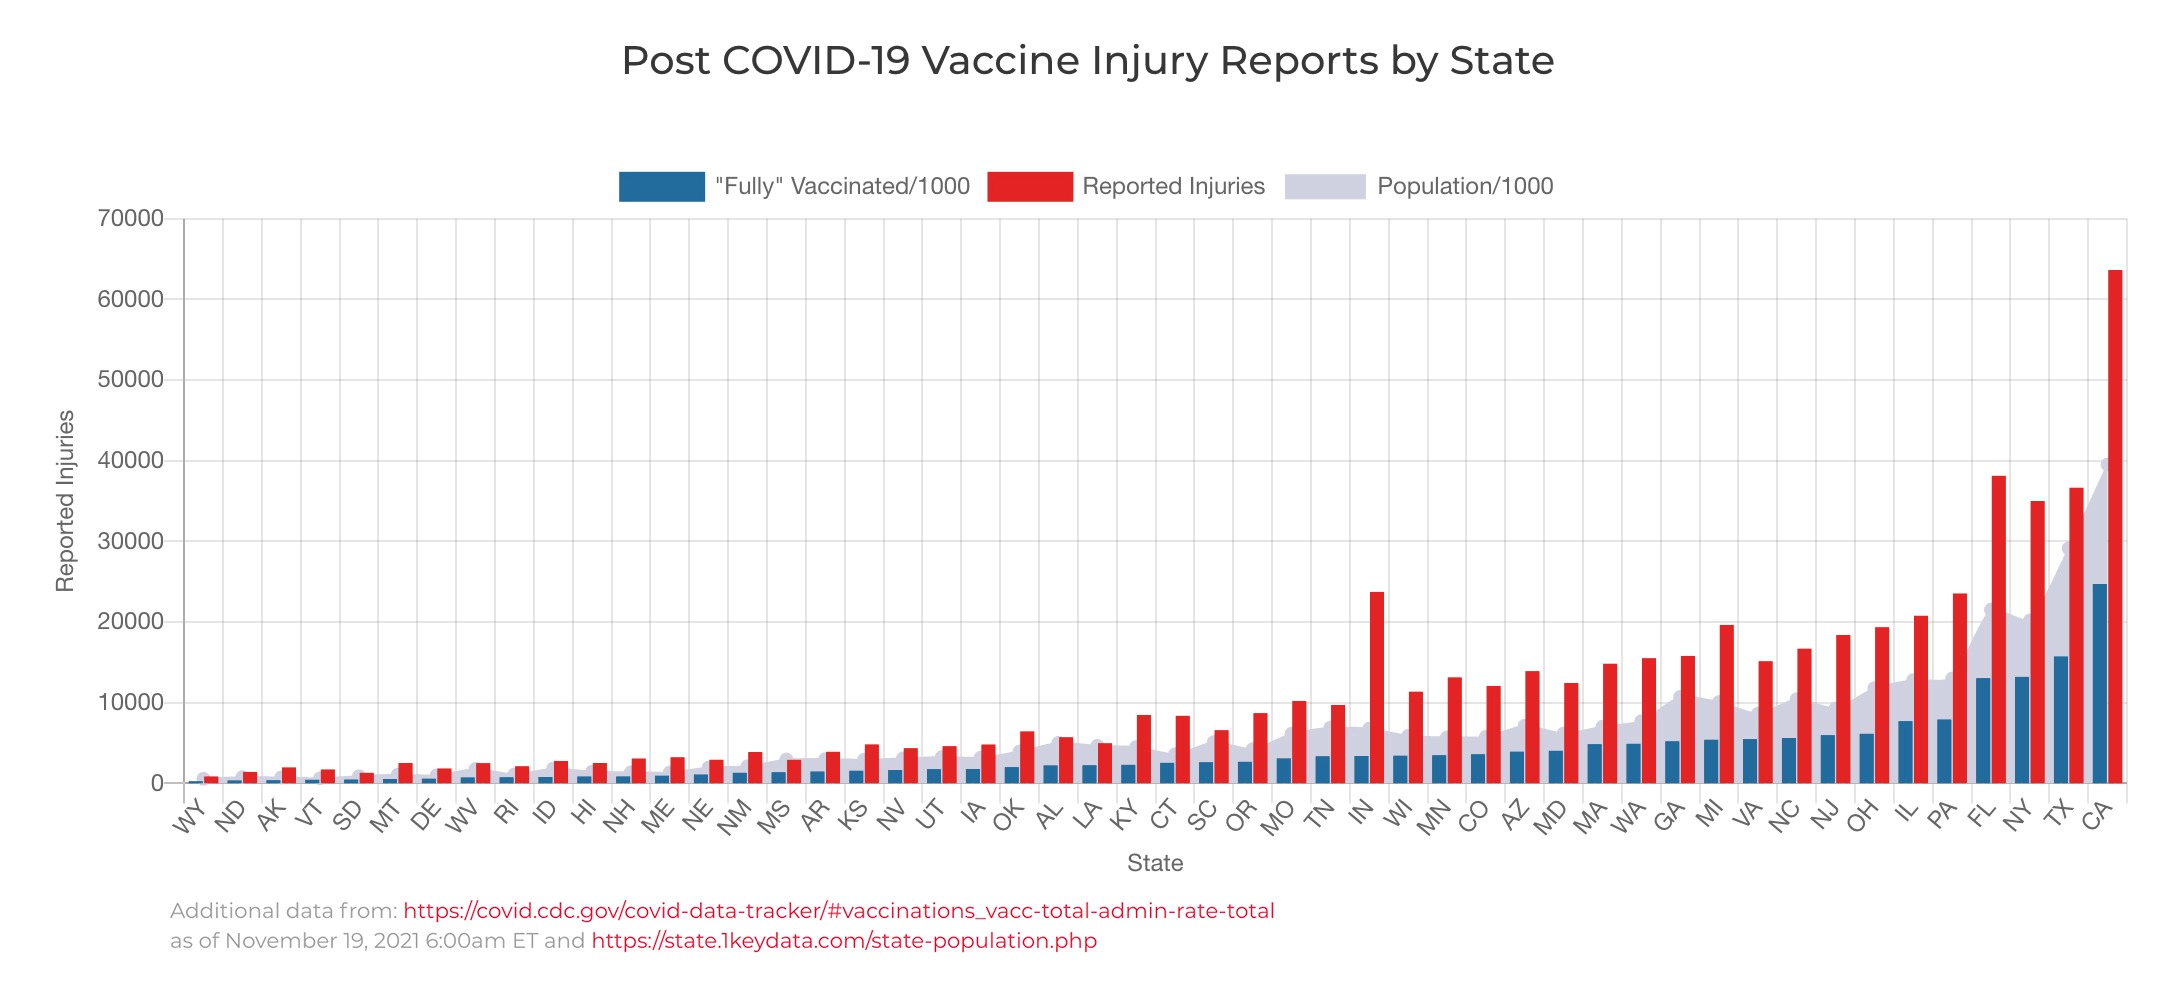
In this week’s OpenVAERS Red Box Report we have produced a chart that adds some extra context to the state reports. Above we graphed the number “Fully” vaccinated (divided by 1,000), the number of covid vaccine injuries reported to VAERS, and the population (divided by 1,000) for all 50 states.
As you can see, the number of COVID-19 vaccine injury reports in each state corresponds to the number of people fully vaccinated in that state. This adds yet more evidence that we are witnessing the greatest safety signal in the 31 year history of VAERS.
The OpenVAERS Team
https://openvaers.com/
Click here to enlarge the preceding graphic:
http://stateofthenation.co/wp-content/uploads/2021/11/stateinjurychart-1.jpg
State of the Nation
November 23, 2021